Setting Safety Stock When Supplier Lead Times Keep Changing
Late deliveries have been common this year. In the September 2026 ISM Manufacturing PMI Report, the Supplier Deliveries Index registered 59%. Anything above 50% means deliveries got slower than the month before, and September was the 10th month in a row above 50%.
That means if you haven't updated the lead time in your reorder formula since the slowdown began, it may no longer match how long your suppliers actually take. Orders also arrive less predictably, and a few extra days of stock may not cover the difference.
- Safety stock is the extra inventory you keep to cover sales and delivery delays beyond what you expect.
- Lead time is the number of days from placing a purchase order to having the stock received and ready to sell.
- Lead time variability is how much that number changes from one order to the next (e.g., one order takes 19 days and the next takes 33). It's usually measured as a standard deviation.
This guide covers how to measure your actual lead times, calculate safety stock that accounts for late deliveries, choose how much stockout risk to accept for each item, and know when to recalculate.
Gather Your Lead Time and Daily Sales Data
The formulas in the next section need four numbers for each item: the average and standard deviation of its lead time, and the average and standard deviation of its daily sales. To get them:
- List the item's last 6 to 10 purchase orders from the past 12 months.
- For each order, count the days from the PO date to the date you received the stock (not the date it shipped or reached port).
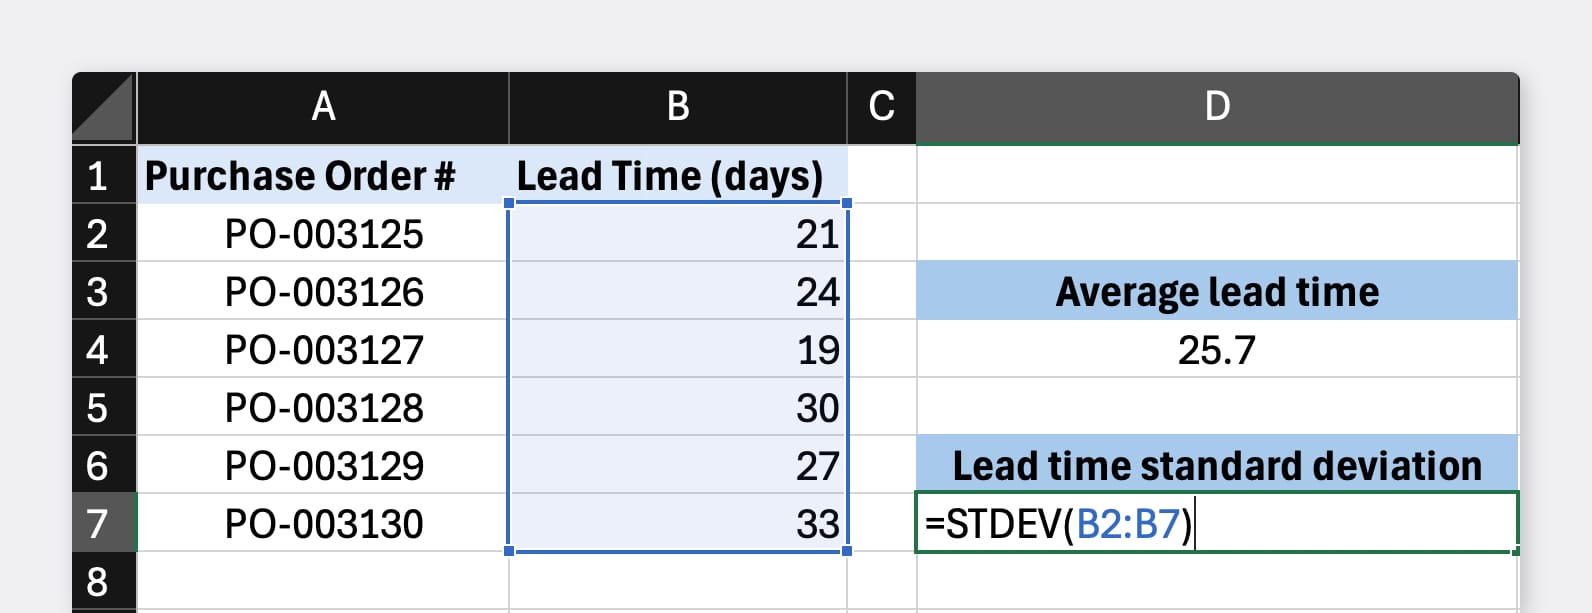
- Calculate the average and standard deviation of those lead times. In a spreadsheet, use
=AVERAGE()and=STDEV(). - Pull the item's daily sales for the past 90 days and calculate the same two numbers. Include days with zero sales, or the average will come out too high.
For example, let's say you run a coffee shop that sells retail bags of Ethiopian Light Roast, which you import from an overseas supplier. Its last six purchase orders took 21, 24, 19, 30, 27, and 33 days to arrive. The supplier quotes 21 days.
- Average lead time: 154 ÷ 6 = 25.7 days
- Lead time standard deviation: 5.35 days
- Longest lead time: 33 days
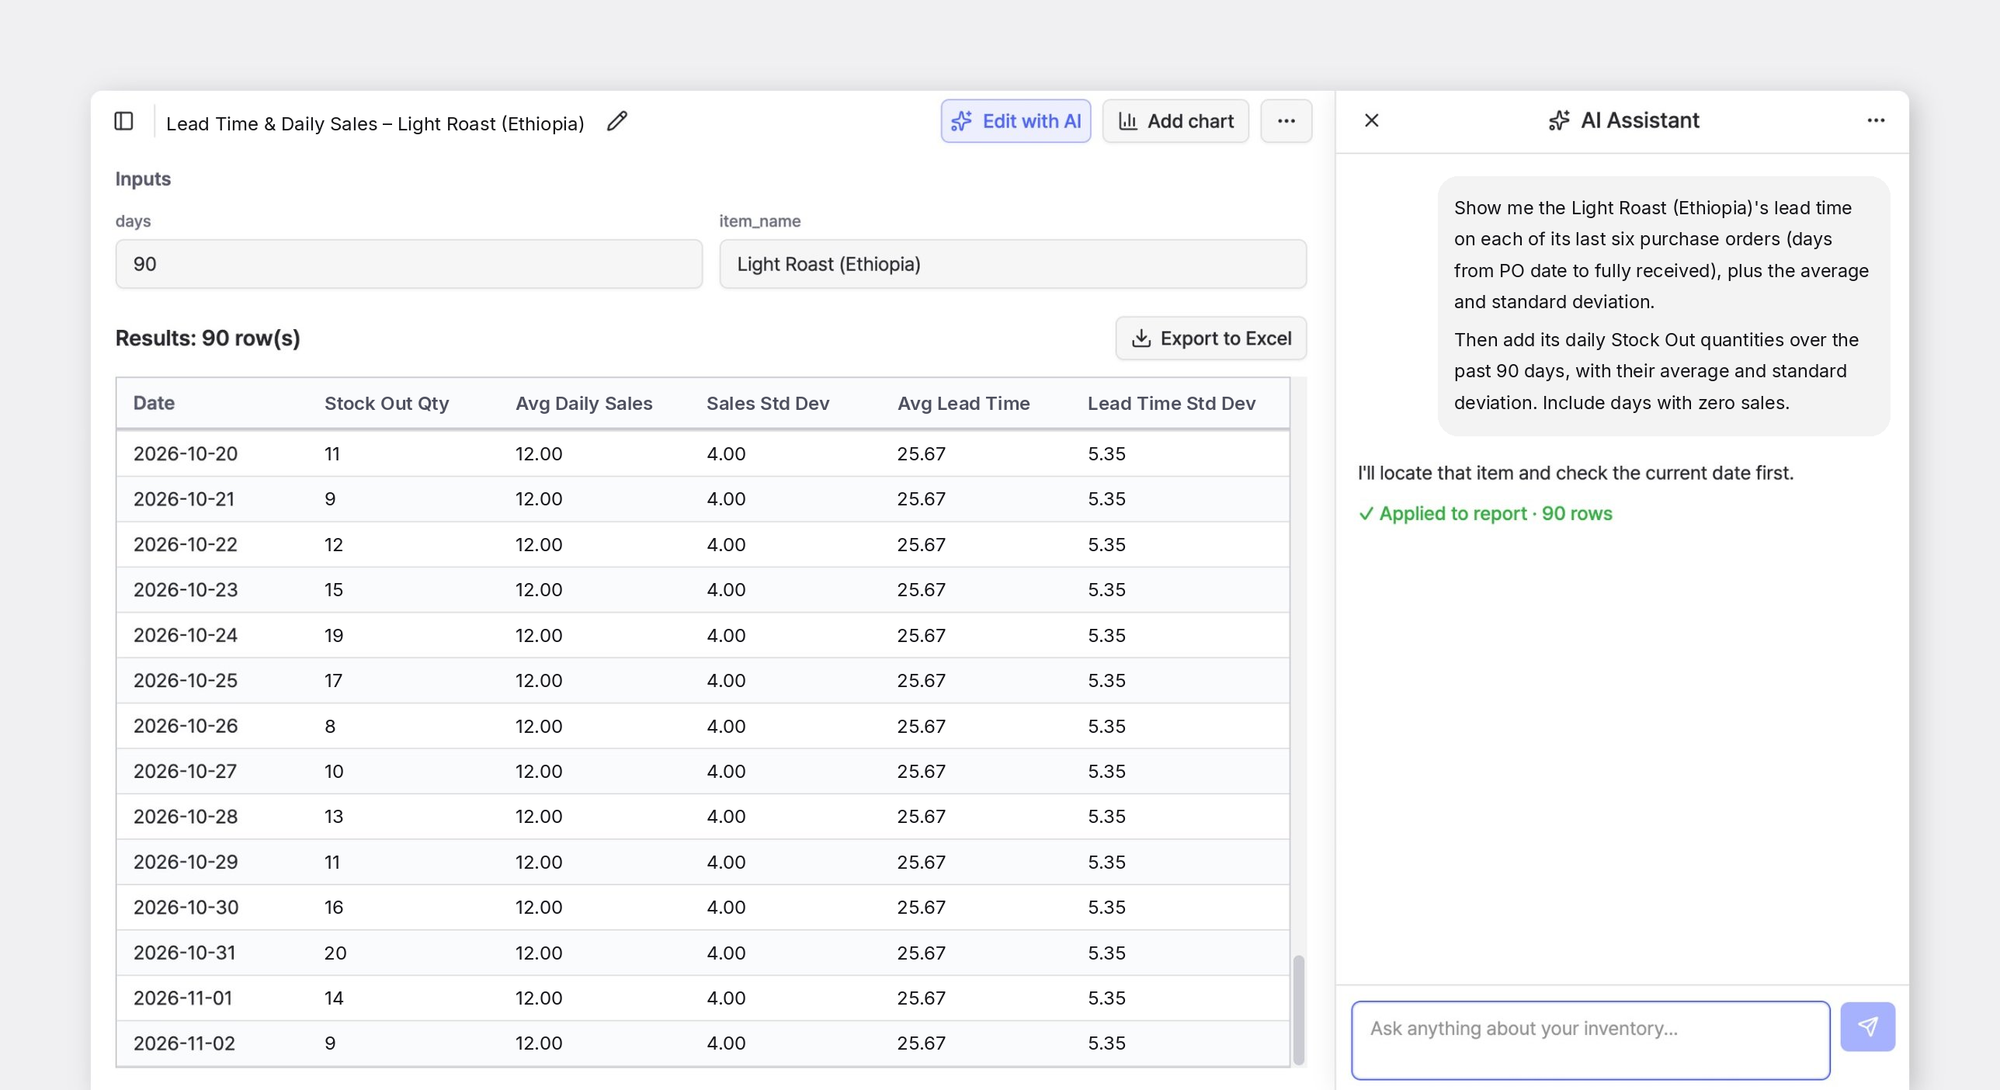
Over the past 90 days, the Light Roast sold an average of 12 units per day, with a standard deviation of 4 units and a peak of 20 units. Its busiest day was 20 units.
On average, orders take almost five days longer than the supplier quotes.
If you use BoxHero, you can skip the four steps above and have the AI Assistant in Custom Analytics calculate the numbers. Ask for the item's lead time on each of its last six purchase orders, plus their average and standard deviation. Then ask for its daily Stock Out quantities over the past 90 days, with their average and standard deviation, including days with zero sales.


Calculate Safety Stock With Lead Time Variability
Many businesses set safety stock as a few days’ worth of sales. For the Light Roast, 3 days of safety stock is 36 bags (12 a day × 3). That amount stays the same even when deliveries slow down. If an order arrives a week late, 36 units covers only three of those seven extra days.
A. Max-Minus-Average Method
This method plans for the worst case in your records: your busiest sales day happening every day of your longest lead time.
For the Light Roast:
- Worst case: 20 × 33 = 660 units
- Expected: 12 × 25.7 = 308 units
- Safety stock: 660 − 308 = 352 units
That's nearly a month of extra stock. The method is easy to calculate and needs no statistics, but the worst case it plans for rarely happens, so it usually leaves you overstocked. Use it for low-cost items, or as an upper limit to compare against Method B.
B. Service-Level Method
This method starts with a target: the share of orders you want to get through without running out before the delivery arrives. That share is your cycle service level. At 95%, you'd expect to run out about once every 20 orders.
Z is a multiplier based on your service level (1.65 for 95%; the table in the next section lists others). SD means standard deviation. The first part under the square root accounts for changes in daily sales, and the second accounts for changes in lead time.
For the Light Roast at a 95% service level:
- Sales term: 25.7 × 4² = 411
- Lead time term: 12² × 5.35² = 4,128
- Square root of the sum: √4,539 = 67.4
- Safety stock: 1.65 × 67.4 = 111.2, rounded up to 112 units
To know when to place an order, add the sales you expect while you wait for delivery:
For the Light Roast, that's (12 × 25.7) + 112 = 420 units, so you place the next order when stock drops to 420. By comparison, a reorder point based on the supplier's 21-day quote plus 3 days of safety stock (288 units) would have run out before three of the last six orders arrived.
Match Service Levels to Each Item's Revenue
The closer you get to 100%, the more safety stock each extra percentage point costs. The table below multiplies 67.4 (the square root from step 3 of Method B) by each Z value, and values the stock at the Light Roast's landed cost of $9.40 per unit.
| Service level | Z | Safety stock (units) | Inventory value |
|---|---|---|---|
| 90% | 1.28 | 87 | $817.80 |
| 95% | 1.65 | 112 | $1,052.80 |
| 97% | 1.88 | 127 | $1,193.80 |
| 98% | 2.05 | 139 | $1,306.60 |
| 99% | 2.33 | 157 | $1,475.80 |
For example, moving from 95% to 99% ties up $423 more in inventory and cuts expected stockouts from 1 in 20 orders to 1 in 100.

Instead of using one service level for every item, rank items by revenue over the past 12 months and give each group a starting level:
- Top items (the best sellers that make up your first 80% of revenue): 97–98%
- Middle items (the next 15% of revenue): 95%
- Bottom items (the last 5% of revenue): 90%
Then adjust individual items with two rules:
- If running out would cost you sales or customers because there's no substitute (e.g., a replacement part for a product you sell), move it up one level.
- If the item is bulky, expires, or costs a lot to store, move it down one level.
For example, if the Light Roast is your second-highest revenue item, it starts at 97%. Safety stock becomes 127 units, and the reorder point becomes 308 + 127 = 435 units. Your 12 oz lids sit in the bottom group, but you can't serve to-go drinks without them, so they move up from 90% to 95%.
Recalculate When Lead Times Move
Recalculate on a fixed schedule (monthly for top items, quarterly for the rest), and also when any of these happen:
- An order arrives outside your normal range (average ± one standard deviation).
- Three orders in a row arrive later than your average.
- You change suppliers, shipping method (e.g., ocean to air), or port of entry.
- Average daily sales change by more than 20%.
Treat longer and shorter lead times differently:
For example, if the Light Roast's next order takes 36 days, recalculating with the six most recent orders raises its reorder point from 435 to 483 units.
Next, enter the new reorder point in BoxHero. In Low Stock Alerts, an item is marked Low Stock when its quantity drops to its safety stock level, and Running Low when it's within 1.2 times that level. Because you want the alert to tell you when to order, enter the reorder point in the safety stock field, not the safety stock you calculated.
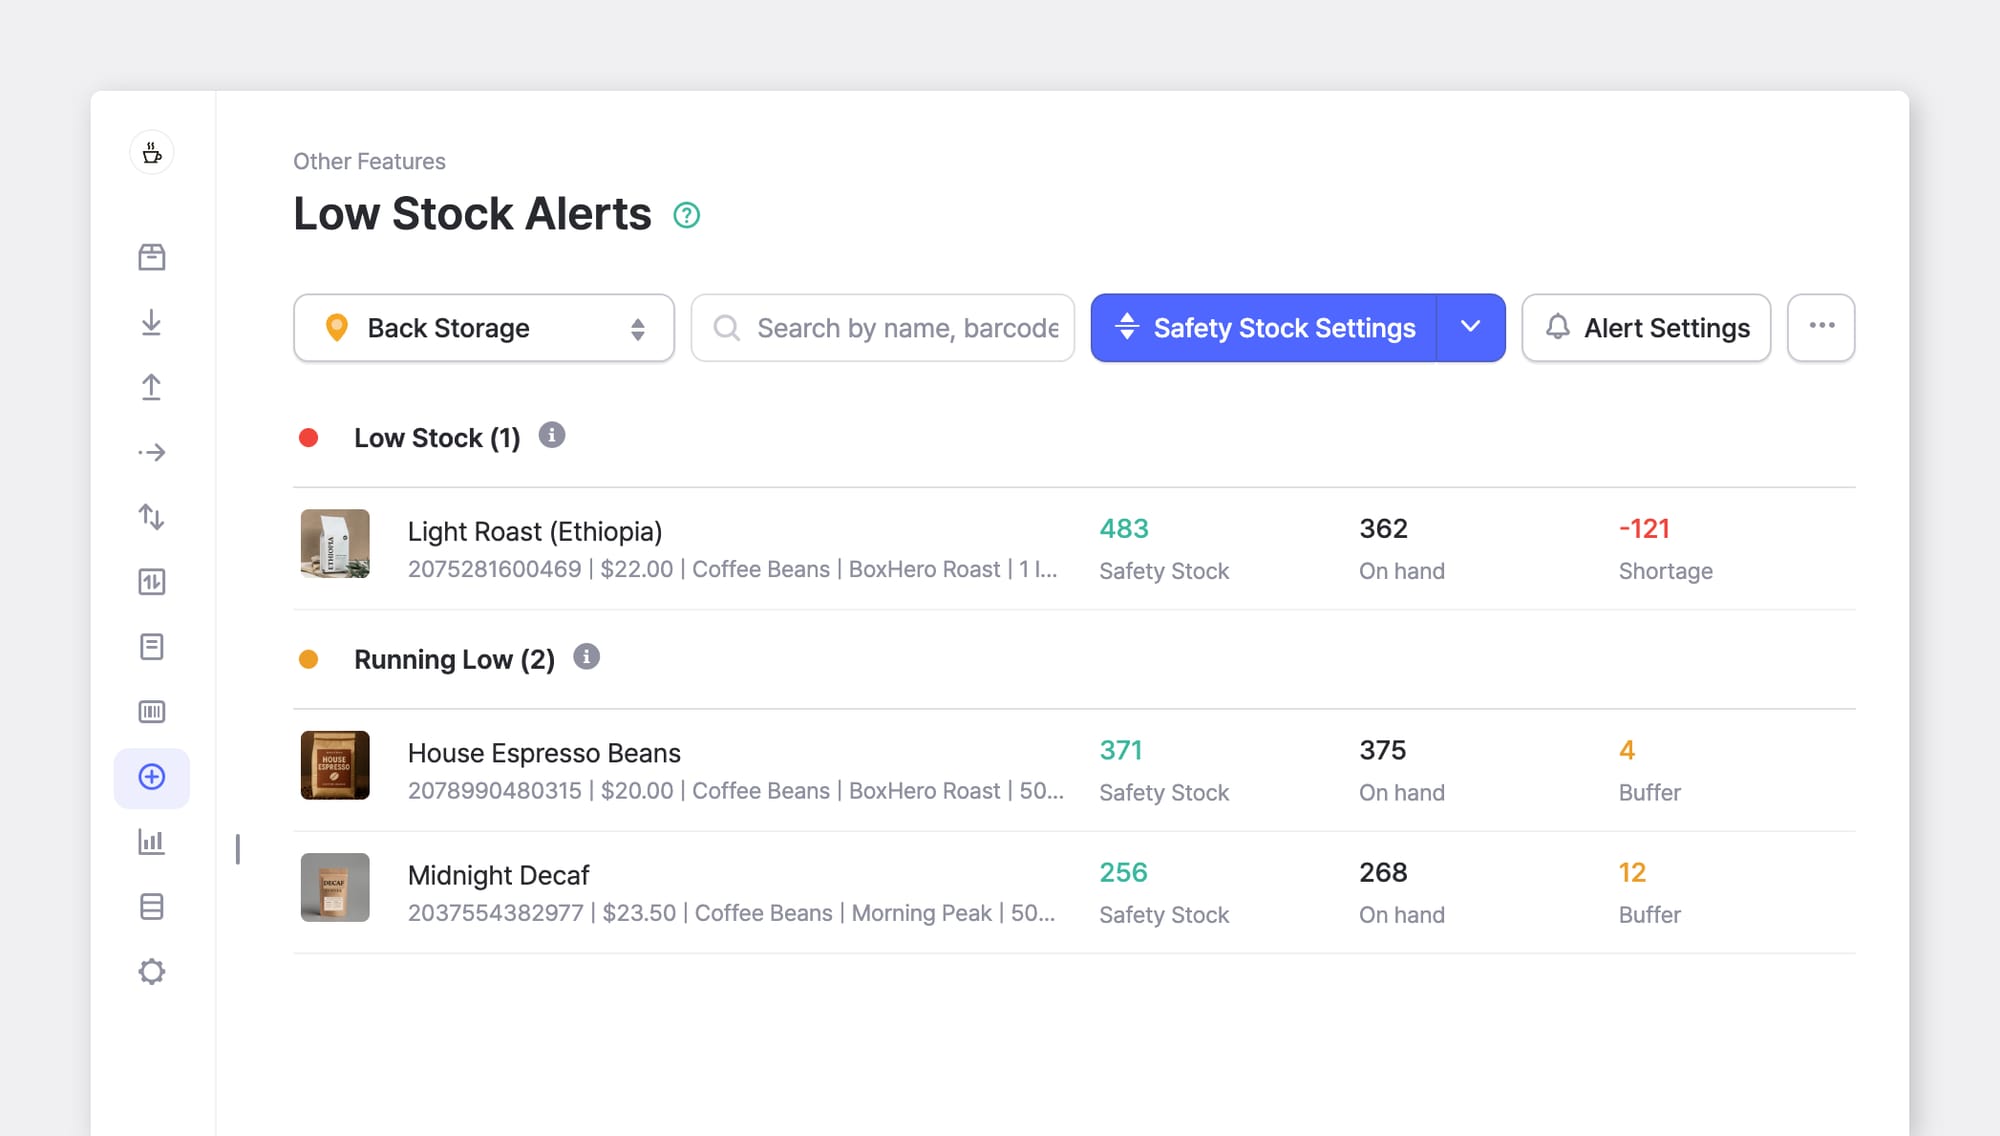


- Go to
Other Features>Low Stock Alertsand choose a location from the dropdown. - Click
Safety Stock Settings, enter a number in the Safety Stock column, and save. - To update many items at once, select
Import from Excelfrom the dropdown next toSafety Stock Settings, fill in the template, and upload it. - Click
Alert Settings, add the person who places orders, and set their alert times and delivery method (Push/Email).
When the alert arrives, create a purchase order for the item and note the PO date. That date is the starting point for measuring the next lead time.
Next Steps
Going forward, add a recurring calendar reminder to review lead times and recalculate reorder points: top items on the first business day of each month, everything else at quarter-end. That way, when a shipment runs late, your reorder point already reflects how long your supplier actually takes, not what it quotes.
RELATED POSTS
 Ahrom Yoo

 Oluniyi Akande

 Nahi Kim