Days on Hand Inventory (DOH): Formulas, Examples, and Pitfalls
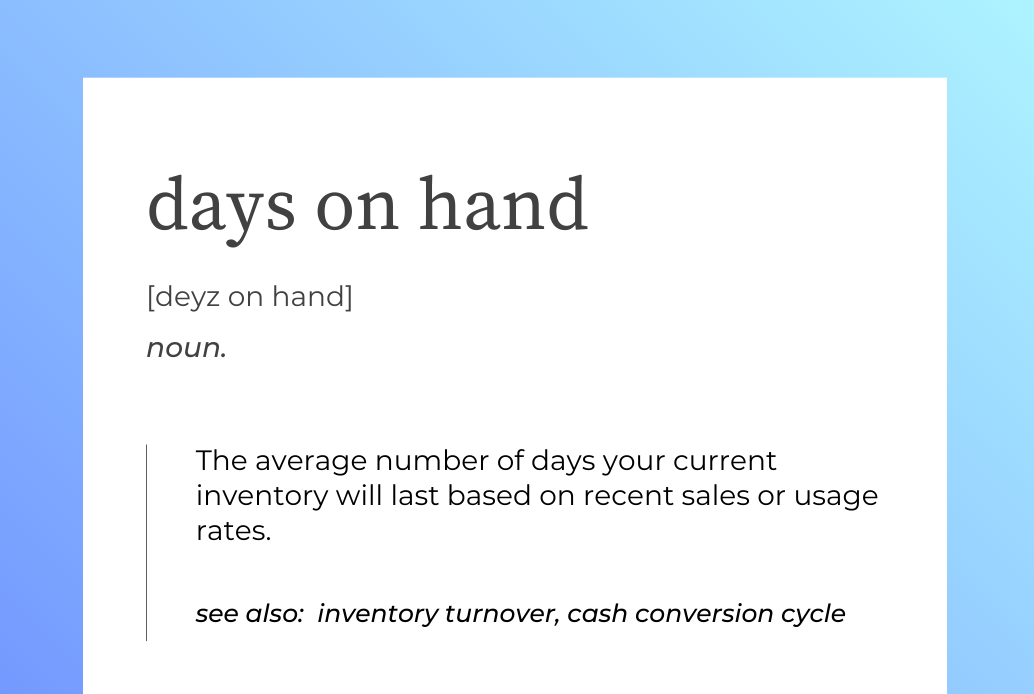
If you run a business that holds stock, Days on Hand Inventory (DOH) is one of the simplest numbers that can tell you a lot about how well you’re managing it. It tells you, in days, how long your current inventory would last at your recent rate of sales or usage.
Said differently: if you stopped buying today, how many days until you run out?
In this article, we’ll cover what DOH is, how to calculate it, where it helps, where it can be misleading, and practical ways to improve it without creating stock-outs.
What “Days on Hand” Measures
Days on Hand Inventory is sometimes also called Days Inventory Outstanding (DIO) or Days Sales of Inventory (DSI). All three mean the same thing: the average number of days your stock stays in storage before it’s sold or used.
The most common formula is:
= (Average Inventory ÷ Cost of Goods Sold) × 365
Where:
- Average Inventory = (Beginning Inventory + Ending Inventory) ÷ 2
- Cost of Goods Sold (COGS) = The total cost of the items you sold over the same period
You can think of DOH as the time-based version of inventory turnover. For example, if your turnover is 8 times a year, that’s about 365 ÷ 8 = 46 days of inventory on hand.

DOH also plays a role in the Cash Conversion Cycle (CCC), a measure of how quickly your business turns inventory into cash. In that calculation, DOH is one of three parts, alongside how long it takes to collect payments from customers (DSO) and how long you take to pay suppliers (DPO):
Where:
- DOH = Days on Hand
- DSO = Days Sales Outstanding
- DPO = Days Payables Outstanding
Example DOH Calculation
Let’s say:
● Ending Inventory = $80,000
Average = ($120,000 + $80,000) / 2 = $100,000
● Annual COGS = $600,000
Then, you get about two months of stock:

You can calculate it for shorter periods, too (e.g., 90 days). Just replace 365 with the number of days in the period you’re measuring.
What’s a “Good” DOH?
There’s no single “right” number. It depends on your industry, product type, and supply chain realities.
- In consumer goods, around 60 days is common.
- In pharmaceuticals, companies may keep 100–180 days of finished goods to meet strict service and safety requirements.
The U.S. Census Bureau’s inventory-to-sales data shows that in mid-2025, retail inventory levels averaged about 1.3 months of supply, with variations by sector. That’s close to long-term norms, suggesting most industries are balancing stock fairly tightly.
The best benchmark is often your own history. Track DOH over time and compare it with businesses similar to yours.
Why is DOH Important?
1. Cash Flow
Inventory ties up cash. Harvard Business Review has long argued that there’s often “an awful lot of capital tied up in receivables and inventory."
Many companies have more money sitting in inventory and unpaid invoices than they realize... and freeing that up can fund growth without taking on debt.
∴ Inventory = Working Capital
2. Stock Health
DOH also signals the balance between service and waste. It helps you see whether your stock levels are healthy:
• Low DOH may signal a risk of stock-outs.
Both are worth watching closely. As Gartner notes, inventory metrics work best when viewed alongside service levels, costs, and cash flow.
DOH is just one part of that bigger picture.
3. Better Cash Flow
Because DOH connects to your cash conversion cycle, improving it—while keeping customers happy—can improve cash flow.
Lowering DOH can make your business faster at turning stock into cash. Amazon’s well-known negative CCC story shows how powerful the math can be when sales collection and supplier terms outpace inventory days.
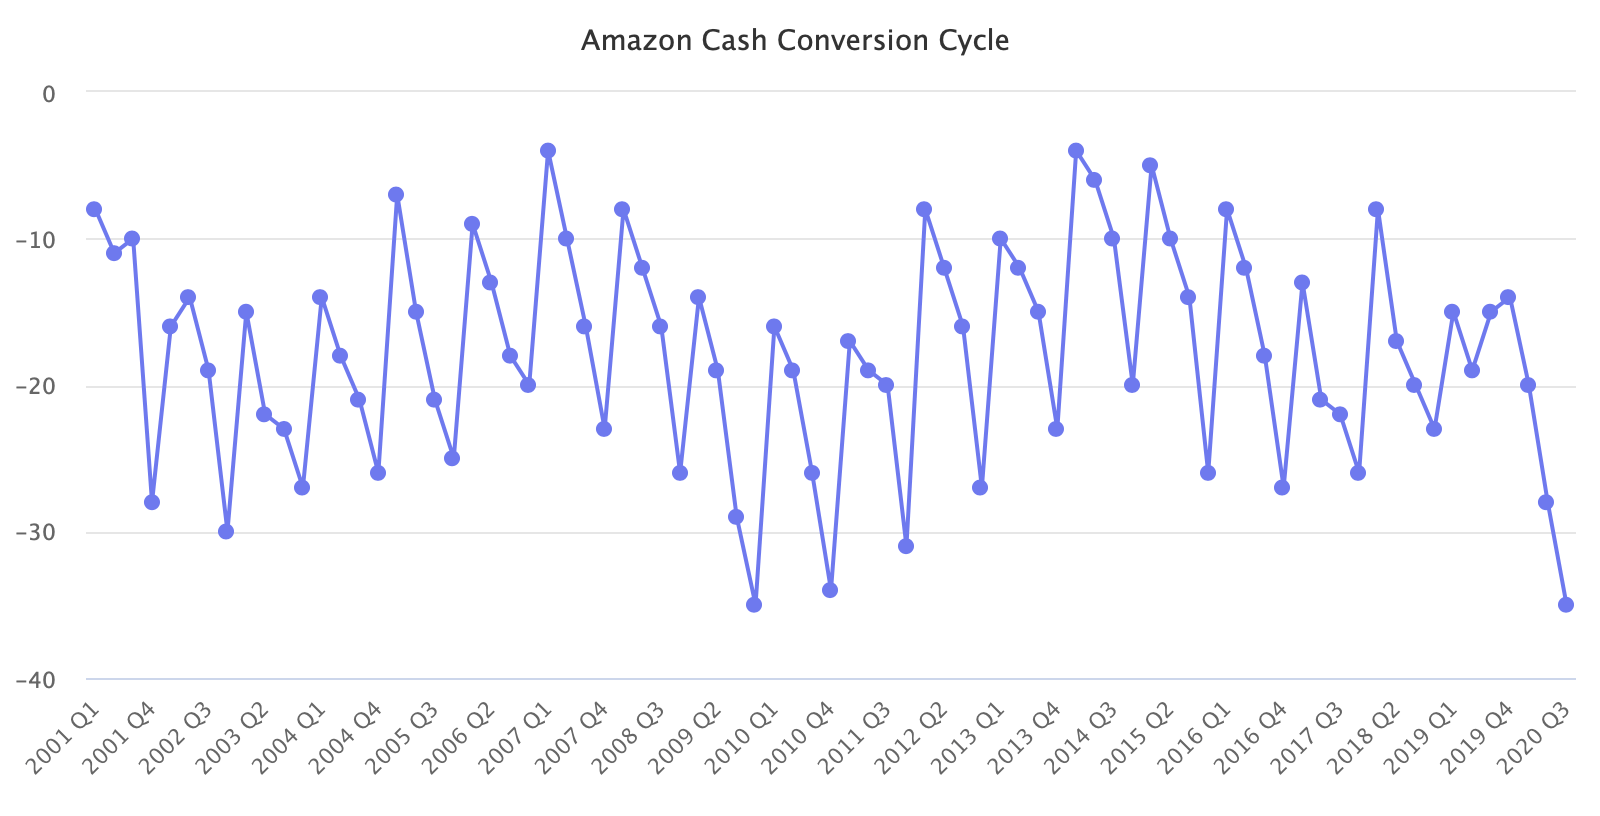
If CCC < 0, means your business collects payments from customers before you have to pay your suppliers. Like Amazon, you can get a built-in cash flow advantage.
Common Pitfalls: Where DOH Can Mislead
1. Averaging hides problems
A single DOH number might look fine overall but hide big differences between items. For example, blending raw materials, work-in-progress, and finished goods into one figure can mask where issues really are.
✅ Solution: Break DOH out by stage or product category.
2. Seasonal swings
Seasonal demand naturally pushes DOH up and down. An annual figure may jump around too much to be useful.
✅ Solution: Compare like periods year over year, or use rolling averages for a steadier view.
3. Price changes
If your costs change, DOH can shift even when your stock levels stay the same. Using COGS means cost inflation or price changes can move DOH even if units don’t.
✅ Solution: Track unit-based coverage (days of stock at current sales rate) alongside cost-based DOH.
4. Large order sizes
Buying in bulk can cause DOH to right after delivery and drop it sharply before the next order. If you buy in container loads, DOH will spike after receipts and fall as you sell down.
✅ Solution: Monitor DOH right after receiving stock and again before reordering to see both ends of the cycle.
How to Improve DOH
1. Check your definitions
Make sure everyone on your team uses the same method to calculate DOH.
Align on how you’ll compute DOH (period, averaging, which COGS). Document the formula so finance and operations don’t talk past each other. *ASCM/APQC definitions are good baselines.
“Having an effective inventory management… is at the core of supply chain and that is making sure that you’ve got the right [item] at the right price with the right consumer at the right place.”
— Abe Eshkenazi (CEO, ASCM)
2. Segment your inventory
Track high-value, high-volume items separately from slow movers. It’s common for fast-sellers to have DOH targets of 15–30 days, while less critical items carry more (e.g., 90–120 days).
- A-items (high value/velocity): tighter DOH targets, frequent review.
- B/C-items: higher DOH is fine if the carrying cost is low.
3. Adjust reorder points
Review lead times and demand patterns. If suppliers are faster now than they used to be, you may be able to lower your reorder levels.
4. Address slow movers
Identify slow-movers with DOH far above target. Run promotions, bundle products, or reduce order quantities to bring down excess stock.
5. Work with suppliers
Huge minimums create spiky receipts and bloated DOH. Negotiate smaller, more frequent deliveries to avoid big inventory spikes.
6. Watch market signals
If overall industry inventories are tightening, you might be able to run leaner. If risks are rising (like tariffs, shipping constraints, or other supply disruptions), it may make sense to hold a little extra.
A Quick DOH Checklist
✅ Track DOH by item category (A-items, B-items).
✅ Revisit reorder points & safety stock regularly.
✅ Review supplier MOQs that cause spiky receipts.
✅ Watch slow-moving items closely.
Frequently Asked Questions
Q: Is lower always better?
Not necessarily. A lower DOH often means stock is moving faster and less cash is tied up, but taking it too low can lead to stock-outs. Set DOH targets that work alongside your service-level goals and supplier lead times.
Q: Can DOH be negative?
No. However, your cash conversion cycle can be negative if you collect payment from customers before paying suppliers and your inventory sells quickly. Some large retailers, like Amazon, have achieved this through fast turnover and favorable payment terms.
Final Takeaway
Days on Hand (DOH) is simply a measure of how long your current stock will last based on recent sales. The real value comes from tracking it consistently and using it to guide decisions:
- Negotiate supplier terms
- Adjust reorder points
- Clear out items that aren’t selling
When DOH is part of your regular review process, it becomes a practical tool for keeping inventory, cash flow, and customer service in balance.
Want to see how DOH fits with other key inventory metrics? Explore how you can track and act on your data with BoxHero.
RELATED POSTS