12 Essential Supply Chain KPIs You Should Measure

Are you constantly juggling inventory levels, struggling to meet delivery deadlines, or battling rising supply chain costs and disruptions? You're not alone; 57% of businesses surveyed by Statista report similar challenges.
Managing your supply chain efficiently is non-negotiable. But how can you assess the efficiency of your supply chain? Key Performance Indicators (KPIs) provide the insights you need. These robust metrics act as your supply chain's report card, giving you a clear picture of what's working well and what needs improvement.
In this article, we'll discuss 12 essential supply chain KPIs that will empower you to make informed, data-driven decisions and optimize your operations.
What are KPIs? Why Do They Matter in Supply Chain Management?
KPIs or key performance indicators are measurable values that track a company's performance, providing essential insights for decision-making. Think of them as a real-time dashboard for your supply chain, showing how well different components are performing and where adjustments are needed.
Here’s how KPIs can serve your business:
- Identify strengths: Discover what your supply chain does well and capitalize on these areas to maximize efficiency.
- Highlight weaknesses: Pinpoint problem areas, gaps, and inefficiencies. Develop strategies to improve them.
- Drive improvement: Use data-driven insights to optimize processes, reduce costs, and improve customer satisfaction.
“From my perspective, choosing relevant and balanced metrics and KPIs is critical for a nuanced understanding of our supply chain performance. For instance, in our operations, we prioritize a balanced scorecard that includes on-time delivery, cost per unit, quality defect rates, and supply chain flexibility. This approach ensures we do not focus excessively on cost reduction at the expense of quality or delivery times.”
Stephanie Cannon, SVP, Operations Excellence and Collaborative Innovation
12 Essential Supply Chain KPIs
Let’s take a look at 12 supply chain KPIs one by one:
- Perfect Order Rate
- Order Fill Rate
- Freight Bill Accuracy
- Freight Cost Per Unit
- Inventory Turnover
- Inventory to Sales Ratio
- Days Sales Outstanding (DSO)
- Days Inventory Outstanding (DIO)
- Backorder Rate
- Customer Order Cycle Time
- Return Rate (Rate of Returns)
- Cash-to-cash Cycle Time
1. Perfect Order Rate
Perfect Order Rate assesses the percentage of orders completed without errors—on time, in full, and with no damage or documentation mistakes. Here’s what it means:
- On-Time: The order must be delivered within the agreed-upon timeframe set by the customer.
- In Full: The order must be complete with all items the customer requested available and delivered.
- Damage Free: The items in the order must arrive in good condition, without any damage.
- Proper Documentation: The order must be accompanied by the correct paperwork, including invoices, packing slips, and any other required documentation to ensure compliance and facilitate processing.
It is calculated using the formula:
Example: For instance, if your company accurately completes 900 out of 950 orders, the Perfect Order Rate is 94.74%.
Perfect Order Rate = (900 / 950)×100 = 94.74%
A high rate means happy customers, fewer returns, and lower operational costs. Top-performing companies aim for a perfect order rate of 95% or higher.
How to improve:
To enhance your Perfect Order Rate, streamline fulfillment processes, conduct rigorous quality control checks, and ensure accurate inventory management. Improving communication between sales, inventory, and fulfillment teams and leveraging technology for automation and real-time data tracking can also significantly boost efficiency and reduce errors.
Aim for perfection but balance it with cost-effectiveness to ensure sustainability. A 100% Perfect Order Rate might not be feasible or economically viable for every business. The key is to find the sweet spot that maximizes customer satisfaction while optimizing your operational costs.
2. Order Fill Rate
The Order Fill Rate is the percentage of customer orders you can fulfill completely from available stock without backorders or lost sales. It's an essential indicator of how well your inventory meets customer demand.
Example: If a company receives 100 orders and completes 95 of them with the inventory on hand, their Order Fill Rate would be:
Order Fill Rate = (95 / 100)×100 = 95%
High order fill rates can reduce customer frustration while waiting for back-ordered items and improve overall service perception.
Maintaining a high order fill rate requires careful inventory management. However, with warehouse rental costs increasing by 11.8% over 12 months to June 2023, it's critical to balance stock levels with storage costs.
How to improve:
- Use better forecasting tools to align inventory levels with anticipated demand.
- Implement robust inventory management systems to track of stock levels and automate reordering processes.
- Develop strong relationships with suppliers to ensure timely restocking and handle supply chain disruptions effectively.

3. Freight Bill Accuracy
In the world of supply chain management, every penny counts. Freight Bill Accuracy measures how often your freight bills match the agreed-upon terms with your carriers, ensuring you're not overpaying for shipping services. Plus, it makes sure that freight bills are free from errors, such as discrepancies in weight, classification, and charges.
Here's how to calculate it:
= (Number of Error-Free Freight Bills / Total Number of Freight Bills) x 100
A report by enVista reveals that only one in 10 freight invoices is error-free, highlighting widespread issues that could lead to unnecessary costs and payment disputes.
How to improve:
- Implement automated auditing systems. Use software that automatically checks freight bills against contracted rates and flags discrepancies.
- Regularly review carrier contracts. Ensure all team members involved in shipping know current rates and terms.
- Train staff on proper documentation. Accurate documentation at the point of shipping can prevent discrepancies later.
- Use data analytics. Analyze trends in freight bills to identify recurring issues or potential areas for negotiation with carriers.
4. Freight Cost Per Unit
Freight Cost Per Unit measures the average transportation cost to ship one unit of product. This KPI helps you understand the efficiency of your shipping operations and their impact on overall product costs.
= Total Freight Cost / Total Number of Units Shipped
Example: If a company spends $10,000 on freight to ship 5,000 units of product, the Freight Cost Per Unit would be: $10,000 / 5,000 = $2 per unit
Efficiently reducing per-unit freight costs can significantly enhance profitability.
How to improve:
- Redesign packaging to reduce weight and size without compromising product safety.
- Combine multiple orders into single shipments when possible to benefit from economies of scale.
- Negotiate better rates with carriers. Use your shipping volume as leverage to secure better rates.
- Implement route optimization. Use software to plan the most efficient delivery routes.
- Consider regional distribution centers for businesses with wide geographic distribution.
5. Inventory Turnover
Inventory Turnover measures how often a company's inventory is sold and replaced over a specific period, typically a year. It indicates how efficiently a company manages its stock.
Alternatively, it can be calculated as:
Example: If a company has an average inventory of $100,000 and annual cost of goods sold of $500,000, the Inventory Turnover would be: $500,000 / $100,000 = 5 times per year
This means the inventory is fully sold and replenished five times a year.
A higher inventory turnover indicates strong sales and effective inventory management. Conversely, a low turnover rate might suggest overstocking or weak demand, tying up valuable resources and potentially leading to higher storage costs.
How to improve:
- Implement just-in-time (JIT) inventory. Order stock only when needed to reduce holding costs.
- Use demand forecasting with historical data and market trends to predict future demand more accurately.
- Focus on high-turnover items and consider phasing out slow-moving products.
- Conduct ABC analysis. Categorize inventory items based on their value and turnover rate to focus on the most important items.
- Consider dropshipping. For some products, having suppliers ship directly to customers can reduce inventory holding costs.
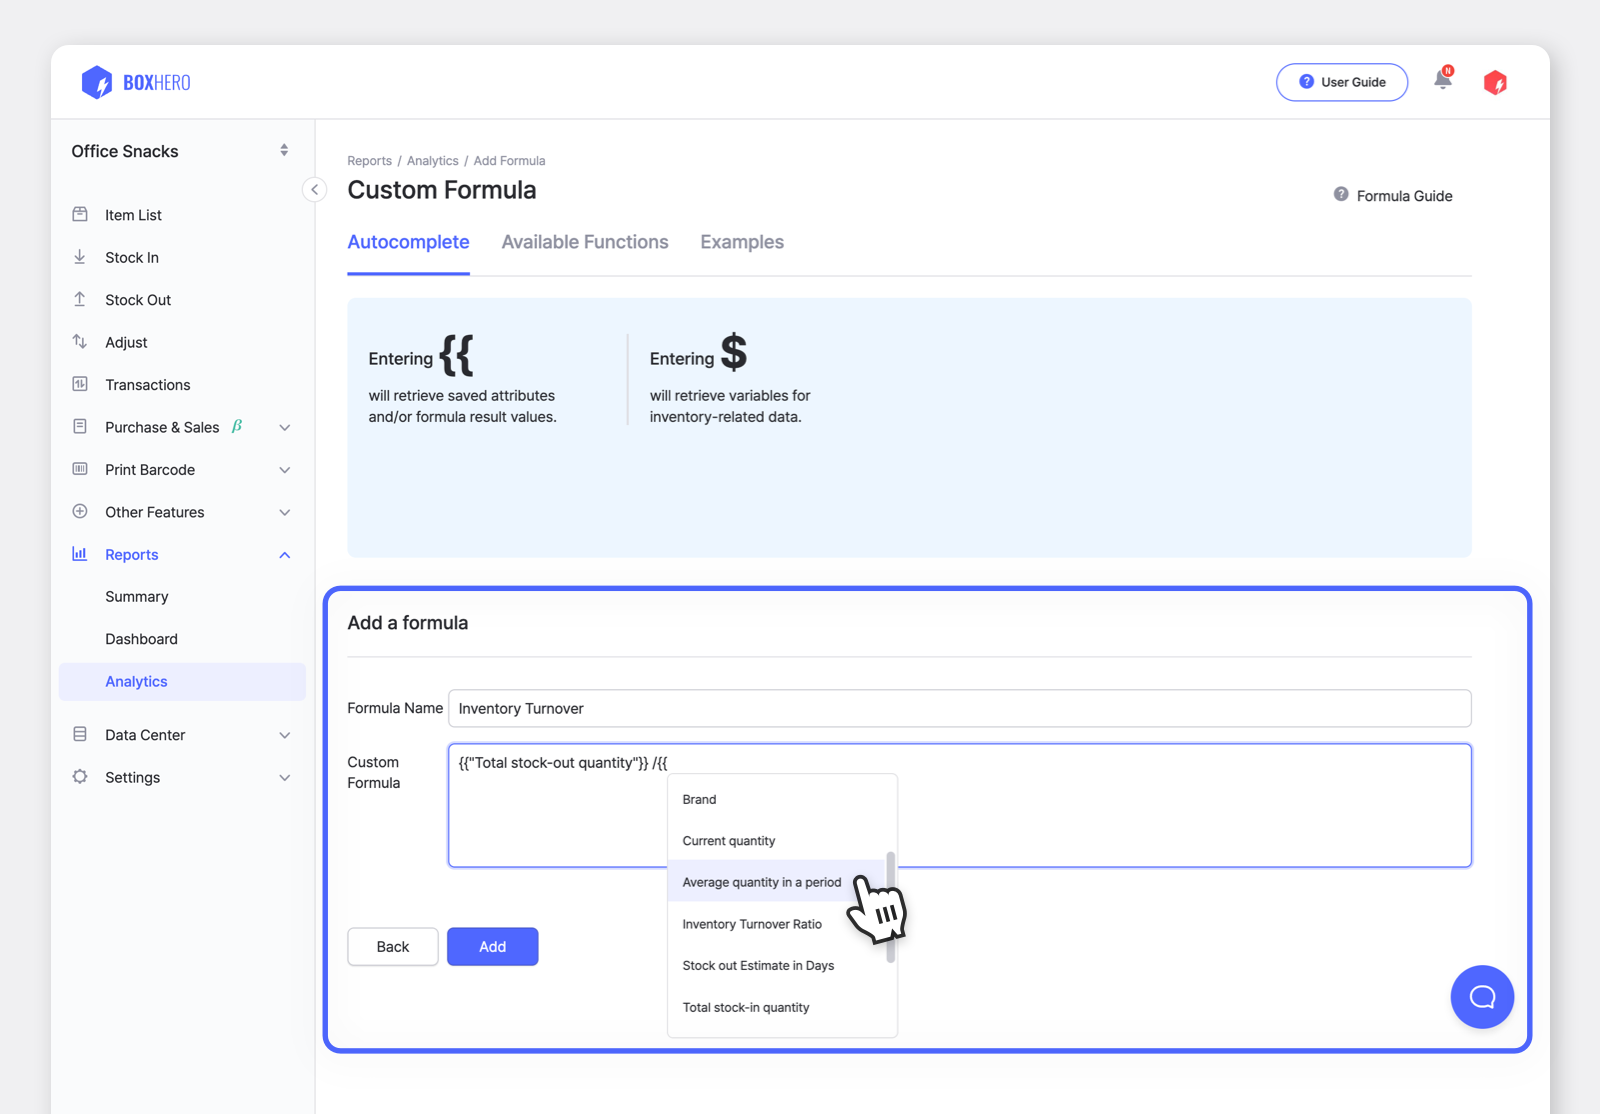
BoxHero's real-time inventory tracking can help you maintain optimal stock levels. Use the Analytics menu to set up a custom formula for Inventory Turnover. This will allow you to track this KPI over time and for different product categories, helping you identify trends and areas for improvement.
6. Inventory to Sales Ratio
The inventory-to-sales ratio measures the amount of inventory a company is holding in comparison to the sales being made. This ratio helps assess whether the inventory levels are appropriate relative to the sales volume.
= Average Inventory Value / Average Monthly Sales
Example: If a company has an average inventory value of $500,000 and average monthly sales of $1,000,000, the Inventory to Sales Ratio would be: $500,000 / $1,000,000 = 0.5 or 50%
A lower ratio generally indicates efficient inventory management, while a higher ratio might suggest overstocking.
How to improve:
All the inventory turnover tips we discussed would also help improve inventory to sales ratio. These include implementing demand forecasting and JIT, optimizing reordering points, and conducting regular audits.
7. Days Sales Outstanding (DSO)
Days Sales Outstanding (DSO) measures the average number of days it takes a company to collect payment after a sale has been made. It's a key indicator of a company's accounts receivable efficiency and overall financial health.
= (Accounts Receivable / Total Credit Sales) x Number of Days in Period
Example: If a company has $500,000 in accounts receivable and $1,500,000 in total credit sales for a 90-day period, the DSO would be: ($500,000 / $1,500,000) x 90 = 30 days
DSO is crucial for understanding a company's cash flow and working capital management. A lower DSO indicates that a company is collecting payments quickly, which is generally better for cash flow.
How to improve:
- Send invoices promptly and ensure they are clear and accurate.
- Make it easier for customers to pay by providing various payment methods and offering discounts.
- Establish a systematic process and reminders for following up on late payments.
8. Days Inventory Outstanding (DIO)
Days Inventory Outstanding (DIO) measures the average number of days a company holds its inventory before selling it. This KPI indicates how efficiently a company manages its inventory levels.
= (Average Inventory / Cost of Goods Sold) x Number of Days in Period
Example: If a company has an average inventory of $500,000 and a cost of goods sold of $2,000,000 for a 365-day period, the DIO would be: ($500,000 / $2,000,000) x 365 = 91.25 days
A lower DIO is typically preferred as it indicates that a company is turning over its inventory quickly and efficiently, suggesting effective inventory management and a better cash flow.
How to improve:
Implement JIT inventory, optimize product mix, consider drop shipping or cross-docking, and conduct regular audits.
9. Backorder Rate
The Backorder Rate measures the percentage of orders that cannot be filled when a customer places an order due to lack of inventory. It indicates how often a company is unable to meet immediate customer demand.
= (Number of Backordered Items / Total Number of Orders) x 100
Example: If a company receives 1,000 orders in a month and 50 of these orders can't be fulfilled immediately due to stock shortages, the Backorder Rate would be: (50 / 1,000) x 100 = 5%
High backorder rates can lead to customer dissatisfaction, lost sales, and potentially lost customers. The good news is that technology is making it easier to keep tabs on inventory levels.
How to improve:
- Maintain a buffer inventory for popular items to cover unexpected spikes in demand.
- Set up automatic reorder notifications when stock reaches a certain level to prevent stockouts.
- Implement systems like BoxHero that provide up-to-date inventory levels across all sales channels.
- If backorders are unavoidable, keep customers informed about expected availability to manage expectations.
10. Customer Order Cycle Time

Customer Order Cycle Time is the total time from when a customer places an order to when they receive the product. This KPI measures the efficiency and responsiveness of the order fulfillment process.
This KPI encompasses the entire order fulfillment process, including processing, picking, packing, and shipping.
= Order Delivery Date - Order Placement Date
Example: If a customer places an order on May 1 and receives it on May 5, the Customer Order Cycle Time would be: May 5 - May 1 = 4 days
A survey showed over 50% of customers demand faster response times. This shows that customer expectations for quick delivery are high, so a customer order cycle time should be as short as possible to ensure customer satisfaction and keep them returning.
How to improve:
- Automate order entry and verification processes to reduce processing time.
- Use techniques like batch picking or zone picking to increase efficiency.
- Use software that can determine the most efficient fulfillment center for each order via the most efficient route.
- Work with carriers to improve shipping speed and consider using multiple carriers for different regions.
11. Return Rate (Rate of Returns)
The Return Rate measures the percentage of sold items that are returned by customers. It indicates customer satisfaction with the products and the accuracy of product descriptions.
= (Number of Units Returned / Total Number of Units Sold) x 100
Example: If a company sells 1,000 units in a month and receives 50 returns, the Return Rate would be: (50 / 1,000) x 100 = 5%
High return rates can seriously impact profitability due to increased handling costs, restocking expenses, and potential loss of customer loyalty.
How to improve:
- Provide accurate, detailed product information to set correct customer expectations.
- Using high-quality images and videos as visual content can help customers better understand the product before purchasing.
- Regularly review why items are being returned to identify and address recurring issues.
- Ensure products are well-protected during shipping to prevent damage-related returns.
- Having a straightforward, fair return policy can actually reduce returns by building customer trust.
- Assist customers with product questions before and after purchase to reduce likelihood of returns.
12. Cash-to-cash Cycle Time
Cash-to-Cash Cycle Time, also known as the Cash Conversion Cycle, measures the time it takes for a company to convert its investments in inventory and other resources into cash flows from sales. It encompasses the entire process from purchasing inventory to collecting payment from customers.
= Days Inventory Outstanding (DIO) + Days Sales Outstanding (DSO) - Days Payable Outstanding (DPO)
Example: If a company has: DIO = 60 days, DSO = 30 days, DPO = 45 days
The Cash-to-Cash Cycle Time would be: 60 + 30 - 45 = 45 days
This KPI is crucial for understanding a company's operational efficiency and cash flow management. A shorter cycle indicates that a company can more quickly recover cash tied up in inventory and accounts receivable, which improves liquidity and reduces the need for external financing.
How to improve:
- Implement just-in-time inventory practices to reduce DIO.
- Improve accounts receivable processes to reduce DSO. Use automations.
- Negotiate better payment terms with suppliers to Extend DPO.
- Reduce the time between receiving an order and shipping it.
- Encourage customers to pay faster by offering discounts for early payment.
The Bottom Line on Supply Chain Metrics

“We need to apply both science and art to understand our true supply chain performance. KPIs as a science tell us about our performance. However, supply chain KPIs should be interpreted across the system versus just within the supply chain."
Ipek Armagan, Finance Strategist and Consultant
To remain competitive and manage complexities in your supply chain, it's essential to use effective metrics. By tracking and optimizing supply chain KPIs, you can pinpoint strengths and areas for improvement, enhancing efficiency and customer satisfaction.
If you're looking to really make the most of these metrics, consider giving BoxHero a try. It can help you manage your inventory better and streamline your order processes. This means you can more easily track and improve how well your supply chain is doing.